Blog 3: Design of Experiments

HEYY GUYS~~
Welcome back to another episode of my blog. Today, I will be sharing more about how I use Design of Experiments (DOE) to.......
DESIGN EXPERIMENTS!!!! DUHHHHH!!!

SOOOO....
What can you expect?
Fundamentals of DOE
Using a case study in the picture below👇👇 to present different design techniques of DOE and their purpose.

Finally, I will be sharing my experience on using DOE
WHAT IS DOE?
To make data collection from complex experiments easier, DOE, or Design of Experiment, is a statistics-based approach to experiment design that collects results from experiments with multiple variables.
It is a methodology used to optimise the experimental process so that less time and resources are used to obtain the desired results. As such, DOE is commonly referred to as the backbone of any product design and process/product improvement efforts.
FULL factorial design
For some background information, this design technique used for data analysis is a technique which is not commonly used due to problems such as time and resource constraints that make it infeasible to run all experiments. However, it is still useful as it can provide us with a larger perspective and understanding of the full effect of every variable in the experiment.
Case study: Using FULL factorial design
WAAAAAAAAIITTTTTTTT!!!!! ✋
I ALMOST FORGOT TO SHARE THE DATA 😅
Therefore, before sharing about the case study, let me share with you the real data collected from the experiment for all 8 runs.....
Run Order | Bowl Diameter (A) | Microwaving time (B) | Power (C) | Bullets (grams) |
1 | + | - | - | 3.57 |
2 | - | + | - | 2.57 |
3 | - | - | + | 0.74 |
4 | + | + | - | 1.57 |
5 | + | - | + | 0.95 |
6 | + | + | + | 0.32 |
7 | - | + | + | 0.57 |
8 | - | - | - | 3.12 |
Table 1: Table of real data collected from case study
From Table 1, an average of every factor at each low and high level is calculated to obtain Table 2.
After which, the total effect of each factor is calculated by taking the difference between the average low and high values.
(-) | (+) | Difference (Total effect) | |
Factor A | 1.75 | 1.6025 | 0.1475 |
Factor B | 2.095 | 1.2575 | 0.8375 |
Factor C | 2.7075 | 0.645 | 2.0625 |
Table 2: Table of average low (-) and high (-) results and its total effect of different variables using FULL factorial design
For those who are new to DOE, to save you from the confusion, the table above was obtained using the case study provided to every student.
To determine the effect of single factors and their rankings, this table is usually used as a convenient way of creating a line graph which can depict the significance of each factor using the help of different coloured lines and their difference in gradients.
Hence, from the table above, I PRESENT YOU.......
DRUM ROLL PLEASEE!!!!!!!🥁🥁🥁
THE GRAPH BELOW!! 🥳👏

To determine the significance of the effect or commonly referred to as the total effect, the difference between low and high levels is used.
According to Figure 1, we can see that the microwave power (Factor C) has the greatest effect due to its steeper gradient between low and high levels, indicating that it has the largest difference in bullet mass of 2.0625 grams and the largest total effect. Hence, Factor C is ranked first in terms of the significance of its effect on bullet mass.
In second place, we have microwaving time (Factor B) which has the second greatest effect due to its slightly smoother gradient compared to Factor C between low and high levels, indicating that it has the second largest difference in bullet mass of 0.8375 grams. Hence, Factor B is ranked second in terms of its significance on bullet mass.
Last but not least, we have Bowl diameter (Factor A) which has the smallest effect on bullet mass due to its smooth gradient between low and high levels. This indicates that it has the smallest total effect on bullet mass due to its small difference in bullet mass of 0.1475 grams. Hence, Factor A is ranked last in terms of its significance on bullet mass.
Next, let's look at the interaction effects of the variables.

From Figure 2, it can be seen that the low microwaving time has a positive gradient which indicates that the bullet mass increases as bowl diameter increases. On the other hand, the high microwaving time has a negative gradient which indicates that the bullet mass decreases as bowl diameter increases. Therefore, there is significant interaction between bowl diameter and microwaving time.
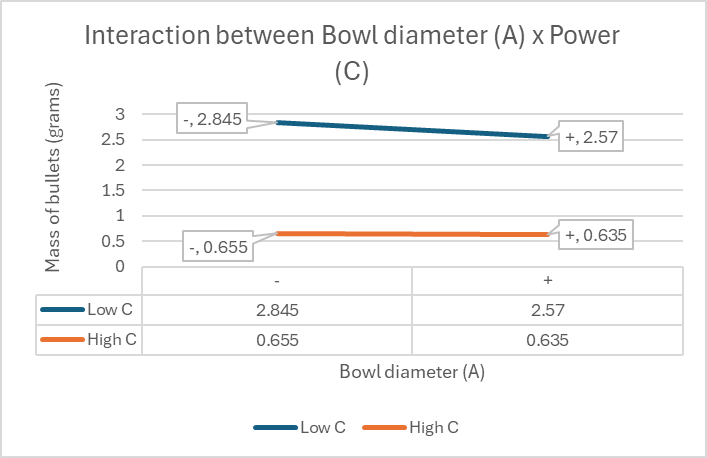
From Figure 3, it can be seen that the low-power has a negative gradient which indicates that the bullet mass decreases as the bowl diameter increases. It can also be seen that the high-power has a smoother negative gradient which indicates that there is a slight decrease in bullet mass as the bowl diameter increases. Hence, there is moderate interaction between bowl diameter and power.

From Figure 4, it can be seen that the low-power has a negative gradient which indicates that the bullet mass decreases as the microwaving time increases. It can also be seen that the high-power has a smoother negative gradient which indicates that there is a slight decrease in bullet mass as the microwaving time increases. Therefore, there is moderate interaction between microwaving time and power.
FRACTIONAL factorial design
For those who don't know, FRACTIONAL factorial design is a method of DOE that provides sufficient information to determine the effect of each factor despite using a selected few runs for experimentation. This method is commonly used as it is more efficient, resource-effective and realistic as less time and materials are used for collecting results. However, due to the reduced number of runs, there is always a risk of missing out information.
This method also requires an additional step of determining the suitable runs for the experiment. Usually and conveniently, the run numbers can be presented in a cube whereby all factors occur at both low and high levels the same number of times as seen from the graph below.

From the statistical orthogonality method seen above, the cubic chart gives us an orthogonal structure which helps us select 4 out of 8 runs that provide a balanced design that also provides good statistical properties.
Case study: Using FRACTIONAL factorial design
Before sharing more about the case study, I would like that share that after using the statistical orthogonality method, I have chosen to use runs 1, 2, 3 and 6 which gives me the data collected in the Table 3 below.
Runs | A | B | C | Bullet (grams) |
1 | + | - | - | 3.57 |
2 | - | + | - | 2.57 |
3 | - | - | + | 0.74 |
6 | + | + | + | 0.32 |
Table 3: Table of real data of selected runs collected from case study
The reason why these runs were used is because they are able to provide a design that is balanced in both low and high levels for each factor which will still allow us to be able to collect sufficient information to determine the effect of each factor.
Alternatively, runs 4, 5, 7 and 8 could also be used. However, for this case study we will be using runs 1, 2, 3 and 6.
From Table 3, an average of every factor at each low and high level is calculated to obtain Table 4.
After which, the total effect of each factor is calculated by taking the difference between the average low and high values.
(-) | (+) | Difference (Total effect) | |
Factor A | 1.655 | 1.945 | -0.29 |
Factor B | 2.155 | 1.445 | 0.71 |
Factor C | 3.07 | 0.53 | 2.54 |
Table 4: Table of average low (-) and high (-) results and the total effect of different variables using FRACTIONAL factorial design
After 4 runs have been selected through the statistical orthogonality method, table 2 is tabulated to obtain the graph below.

To determine the significance of the effect and rank the factors, the difference between low and high levels is used.
According to Figure 6, we can see that microwave power (Factor C) has the most significant effect on the bullet mass as it has the steepest gradient between low and high levels. This indicates that Factor C has the largest difference in bullet mass of 2.54 grams. Hence, Factor C will be ranked first in terms of its total effect on bullet mass.
Secondly, we can also see from Figure 6 that Factor B has the second steepest gradient between low and high levels. This indicates that Factor B has the second largest difference in bullet mass of 0.71 grams. Hence, Factor B will be ranked second in terms of its significance of effect on bullet mass.
Lastly, from Figure 6, we can see that Factor A has the smoothest gradient, indicating that it has the smallest difference in bullet mass of 0.29 grams between high and low levels. Hence, Factor A will be ranked last in terms of its significance of effect on bullet mass.
Reflection

Personally, learning about DOE was very confusing and frustrating as I was faced with many challenges such as having to use and organise complex data. Furthermore, having to create and explain the graph also posed its own difficulties.
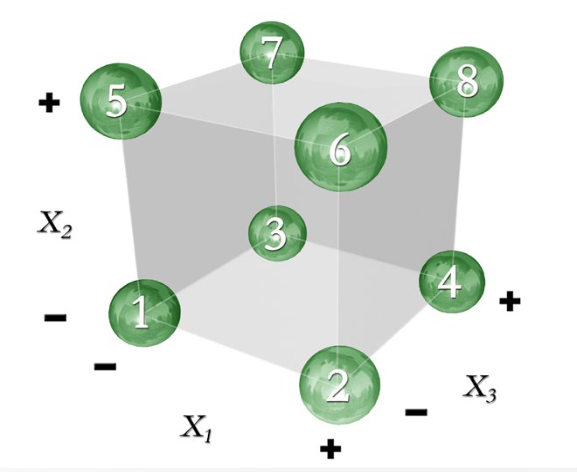
One such example was when I was completing our pre-practical assignment where we had to present our data using the DOE methods we learnt in class. While completing this assignment, I felt very lost and confused about how to organise and explain the data provided by the pre-practical. This caused me to make many mistakes such as randomly choosing 4 out of 8 runs to perform FRACTIONAL factorial design instead of using the statistical orthogonality approach in Figure 7 below to select 4 runs that are balanced in both low and high levels of every factor.

Fortunately, with the help of my friends, I understood the use of the statistical orthogonality method that provided a balanced design for the experiment while allowing us to achieve sufficient information to determine the effect of the factors. Additionally, their help also allowed me to gain a better understanding of how I should present and explain my data as I referred to the tables below provided by the learning materials from our lessons. Hence...
THANK YOU TO ALL MY FRIENDS!!
And I would also like to say that by overcoming these challenges I was able to gain a new understanding and skillset that equips me with skills for product designing as a chemical engineer.
This invaluable skill will be especially useful in an upcoming project where we have to perform product design with a limited budget, time and resources.

P.S. For those who are wondering, the product that my group has decided on is an Automated Tea Brewer. Although I won't be sharing about it in this blog, do stay tuned for the next one!
BACK TO WHAT I WAS SAYINNNGG.....

Aside from gaining new skills, I found myself being able to sharpen the skills I already had such as communication and the use of Microsoft EXCEL. While doing the pre-practical, I had to use Microsoft EXCEL to create tables such as the one seen in Table 3 below. To obtain the table as seen below in Figure 8, I had to use EXCEL functions such as Subtraction, Addition and Average to calculate the desired numbers. Furthermore, I had to use the EXCEL insert function to create a line graph and format the graphs in a presentable manner such as the one seen in Figure 9.

- | + | |
Stirrer Speed (A) | 146.3 | 99.9 |
Temperature (B) | 170.9 | 75.3 |
Vessel Diameter (C) | 117.8 | 128.4 |
Table 3: Table of average low (-) and high (-) results and the total effect of different variables using FULL factorial design using Figure 8

On the other hand, during our practical, communication was very important. This is especially true because I was the data logger of my group and had to constantly be updated on the runs and replicates that my group was conducting so that the correct data could be logged and analysed. I also had to communicate with my group so that they were aware of any outliers in the data collected so that we could find solutions to prevent more outliers. If there was a lack of communication it may have messed up our results collected. Hence, I realised that communication is KEY, especially during group assignments where one mistake or a missing piece of information can greatly affect the results of the group.
P.S. The red stickman is me since I was the one taking the picture🤣
Looking back at this experience, I realise how grateful and glad I feel to have learned about the DOE. It was a very enriching and insightful experience that allowed me to learn new skills such as the FRACTIONAL factorial design method which made me realise how DOE plays a very important role in product design, especially in the current state of the world where sustainability is emphasised due to limited resources. Not only that, but it also me realise that it is important to work on sub-skills such as communication and Microsoft EXCEL as they will be extremely useful in the industry where we, chemical engineers, will always work efficiently as a team, and collect and present data.
That's all for my third blog!!
THANKS SO MUCH FOR READING!!!!
For me, this experience was easier when compared to coding. However, it still posed its unique difficulties that put me through many stressful situations. It is truly an experience which I will never forget and will always cherish!!
I hope my blog has been informative as to what DOE is!!!
PLEASE 🙏 LOOK FORWARD TO MY NEXT BLOG!! HAHAHAHAHHAAH


Comments